
Transition: Data Analyst to Data Engineer
Interested in working in the data engineering landscape, check out this natural transition for Data Analyst.
Wrapping up the series of Transition into Data Engineering with the last article for Data Analysts. Last time, I shared the natural transition for Data Scientist, this article is similar but with more focused and easy route for Analysts.
Key Points:
The article will cover the natural way to transition from Data Analysts to Data Engineer.
The focus would be for the folks who already have basic experience.
This may not apply to all types of Data Analysts, it highly depends on what your day to day look like.
A place where Data Engineer and Data Analyst overlaps.
Why this Transition?
Data Engineering is an excellent career move for Data Analysts aiming to advance. It offers higher demand, better pay, and greater relevance in today’s industry. As AI grows, many basic analyst roles are likely to be replaced.
Let’s dive:
In the initial article here, I shared the following six expertise from a Data Engineering perspective:
Data Infrastructure Expert
Data Tooling Expert
Data Pipeline Expert
Data Modeling Expert
Data Visualization Expert
Data Domain Expert
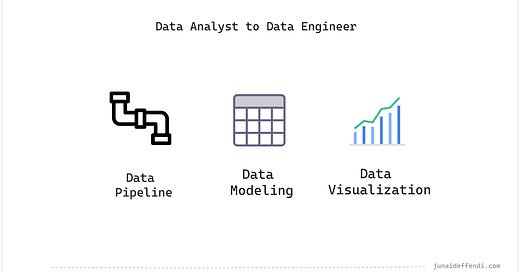
To make the transition as natural and easier as possible, the best ones to consider are the Data Pipeline, Modeling, Visualization Expertise. These three expertise are a common place where Data Engineer and Analyst work overlaps, this is also known as Analytics Engineering in today’s world.
⭐ I call this transition very effective as this unlocks great potential.
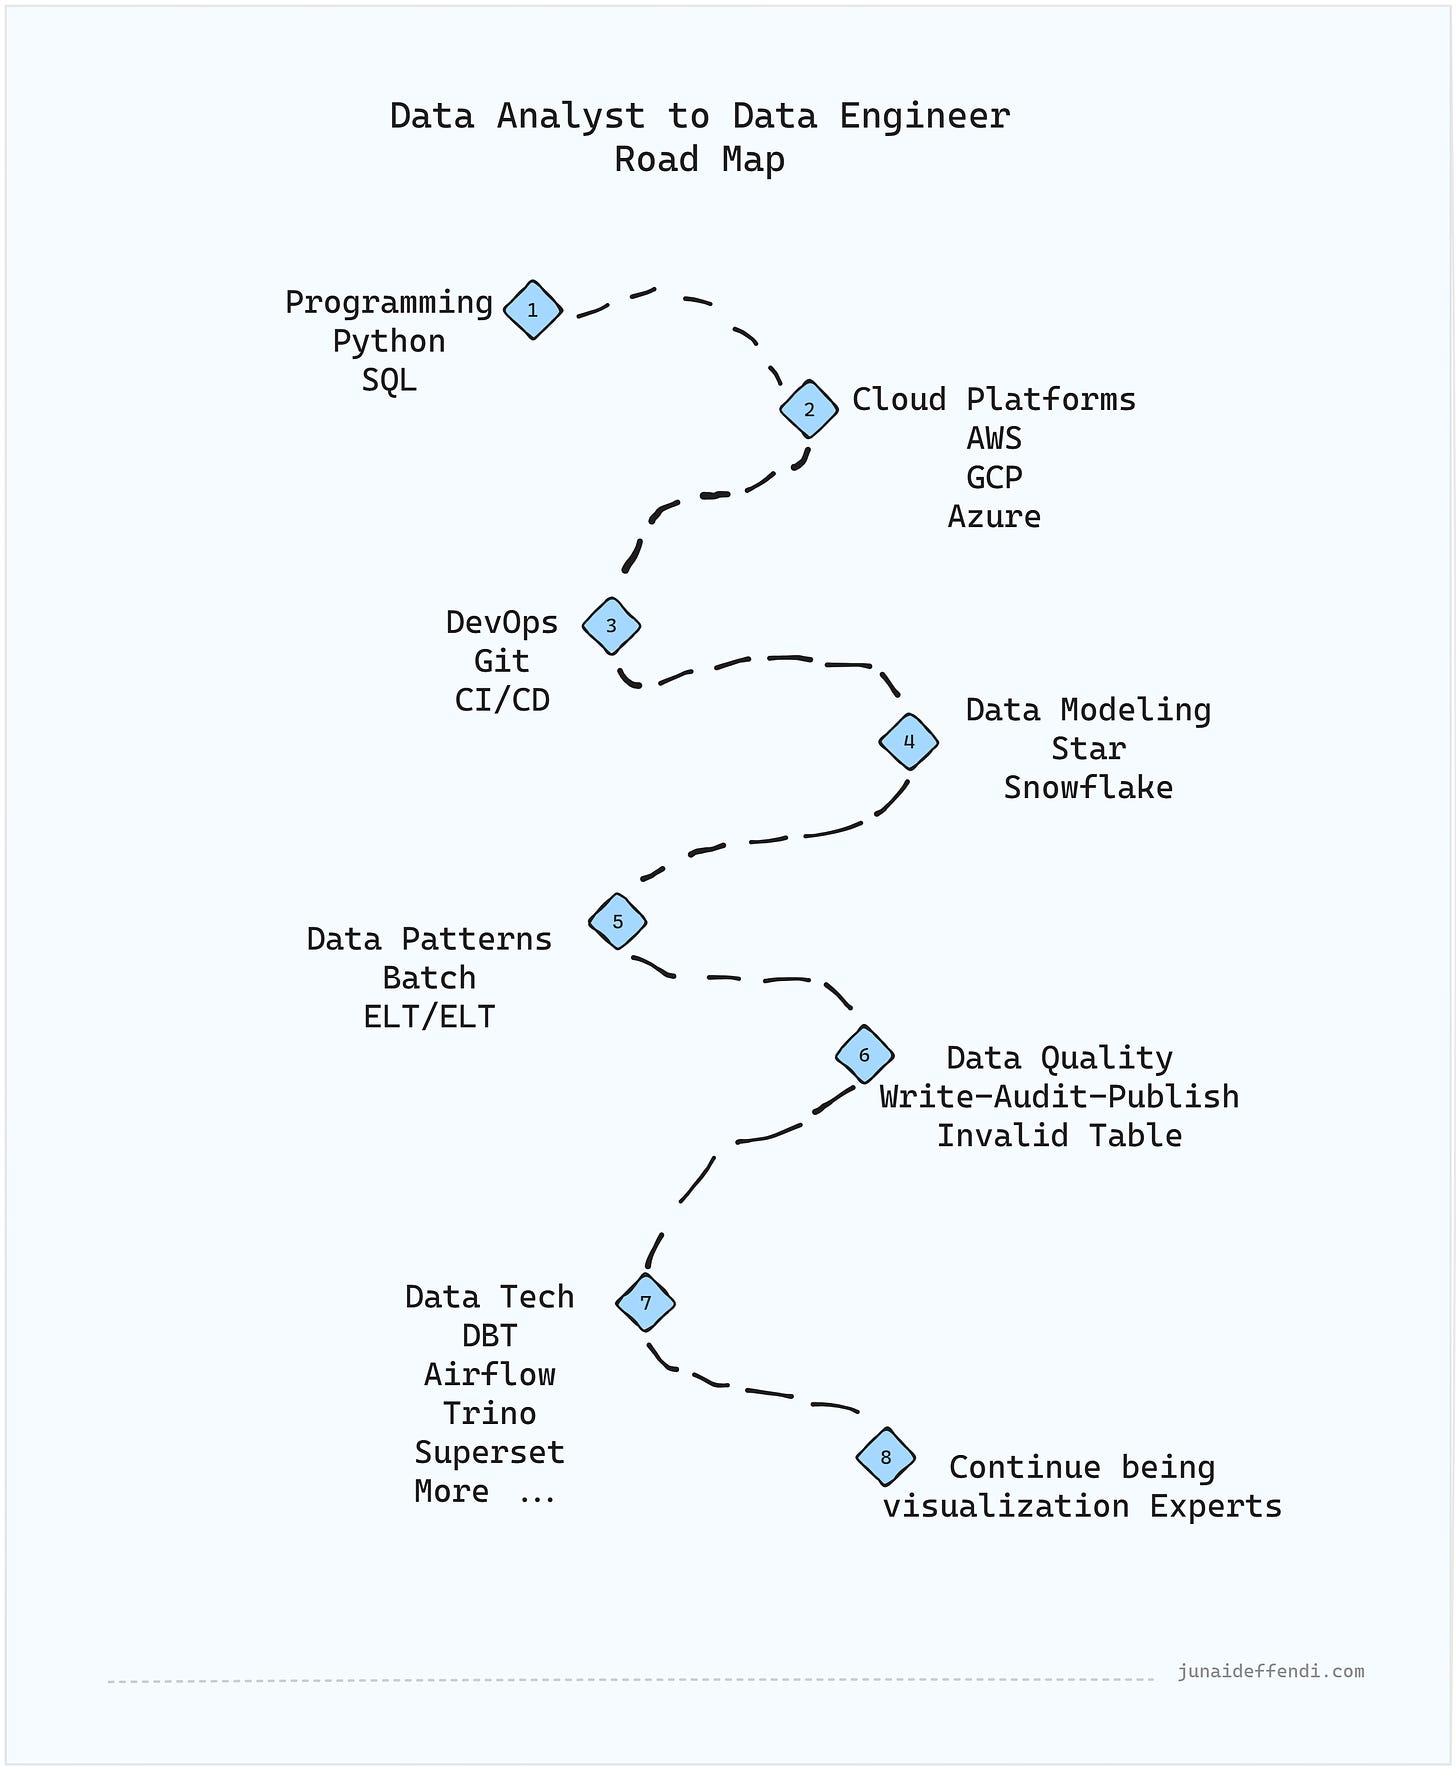
Roadmap
It is pretty challenging to cover everything, I will focus on the most important based on industry standards and my personal experience that will help you get started.
💡You don’t need to know everything in the roadmap.
💡Based on your experience you can easily plan and learn the most useful and missing components and go from there.
Programming
Understanding the basics of programming to get into Data Engineering is very important.
Python: Super relevant in today’s data world, most recent data tooling are written in Python. Easiest path to entry as well.
SQL: All time data language, many analyst use DBT which is 100% SQL.
Cloud Platform
Cloud Platforms are the backbone of most tech companies today.
AWS: Understanding the core services like S3 then moving on to data-related services Redshift, Athena, etc.
GCP: Understanding the core services like Cloud Storage, Cloud SQL then moving on to data-related services BigQuery, etc.
Azure: Understanding the core services like Blob Storage then moving on to data-related services Synapse Analytics, etc.
DevOps
Git: Used everywhere as a version control system, learn the best practices.
CI/CD: Building scalable deployment pipelines is something to look for using tools like Gitlab CI and Jenkins.
Data Modeling
Data Analyst already does data modeling of some kind, formalize it for long term impact with the following common techniques.
Star: Very common dimensional data model.
Snowflake: Similar to Star but further normalized.
Data Patterns
Data Analyst need to know the common patterns.
Batch: Pipeline that is performed in batches, e.g. per file or per scheduled interval and incremental or full load.
ETL/ELT: Understanding the concepts of Extract, Transform and Load. How they make impact when designing the pipeline.
Data Quality
Making sure to perform the validation for the data you are producing.
Write-Audit-Publish: This allows to catch data issues early in the pipeline before publishing for end users.
Invalid Table: This allows to make good data available to end users despite having some bad data which lands in different table.
Data Technologies (Open Source)
As a data analyst, you may have worked with many commercial data and visualization tools, the goal is to take this to next level by gaining experience of the open source world.
DBT: Popular for SQL Data Pipelines.
Apache Airflow: Popular for orchestrating data pipelines.
Apache Superset: Popular visualization tool
Apache Trino: Popular for providing SQL layer on top of data lake.
Apache Iceberg: Popular open table format, works well with Trino.
💡There is alot more, checkout here.
Visualization Experts
Data Analysts are already experts in creating dashboards and charts, taking it to next level by learning more advanced types of visualization and programming libraries will make you more effective.
The following articles will help you with the transition:
💬 Since this roadmap can cover much more, I have definitely missed something important, please let me know in the comments.







Thanks for this insight. It was a very comprehensive guide on transitioning. I am myself a BI engineer and looking to explore data engineering